Where might reported WNV-positive mosquito detections occur in Massachusetts?

Environmental relationships and Random Forest modeling of West Nile virus surveillance in Massachusetts

Vanchy Li | Clark University

2026-12-08

The operational question

Where and when are reported WNV detections likely?

  • Massachusetts surveillance data identify positive mosquito samples by municipality and time.
  • Environmental conditions and land cover may help explain seasonal and spatial variation.
  • A forecast must use information available before the target month.
351
municipalities
2014–2026
June–September, excluding 2021

Outcome: reported-positive mosquito samples from Massachusetts arbovirus surveillance (Massachusetts Department of Public Health 2026).

Four data streams create a municipality-month panel

Surveillance

  • Monthly WNV-positive mosquito sample counts
  • Municipality, county, month, and year
  • Zero means no positive report, not necessarily a tested negative

Weather and surface conditions

  • ERA5-Land air temperature, vapor pressure, and precipitation; Earth Engine nominal pixel size 11,132 m (~11.1 km) (Muñoz-Sabater et al. 2021)
  • MODIS daytime and nighttime land-surface temperature (Wan et al. 2021)

Spectral indices

Landscape

  • NLCD land-cover proportions, impervious surface, diversity, edge density, and patch density (U.S. Geological Survey and Dewitz 2023)
  • Municipality area and county identity as geographic proxies

The inputs resolve Massachusetts at very different spatial scales
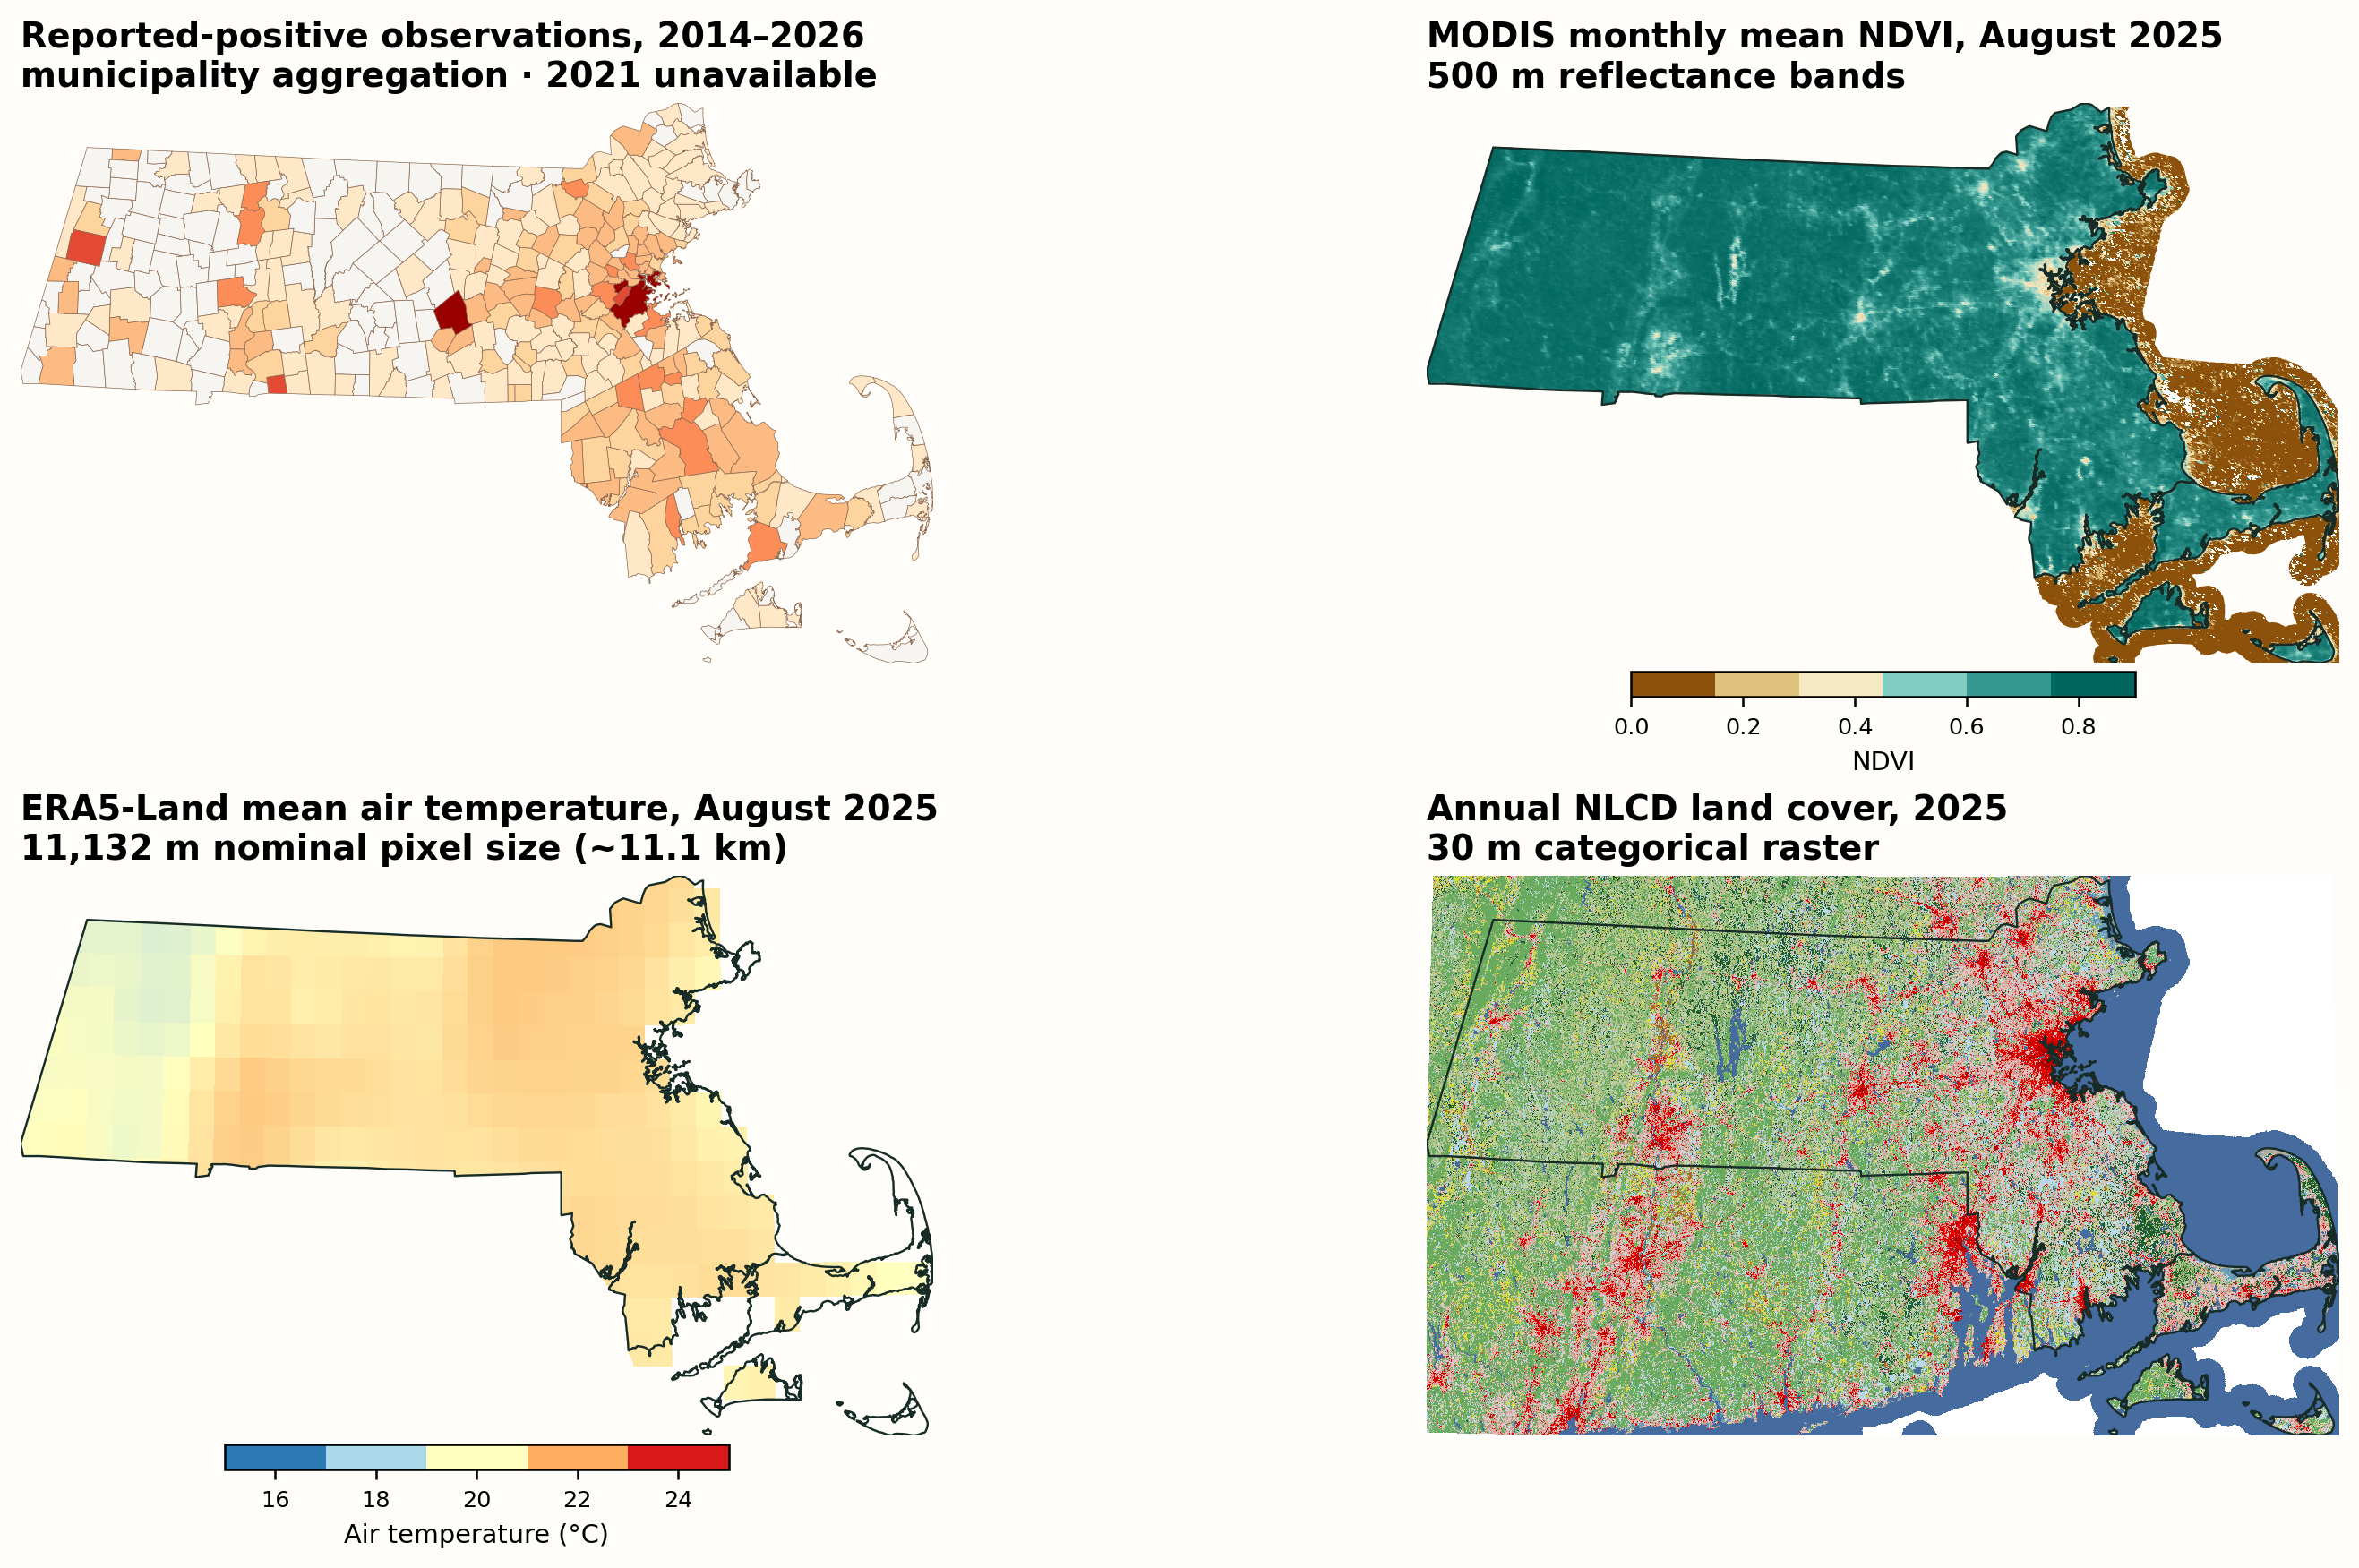
Four Massachusetts maps shown in Massachusetts State Plane coordinates and ordered to match the preceding slide: cumulative municipality-level WNV-positive observations from 2014 through 2026 excluding 2021, August 2025 MODIS NDVI from 500-meter reflectance, August 2025 ERA5-Land air temperature at a nominal 11,132-meter pixel size, and 2025 Annual NLCD land cover at 30 meters.

Same Massachusetts State Plane extent in every panel. Sources: Massachusetts surveillance; MODIS MOD09GA (Vermote and Wolfe 2021); ERA5-Land (Muñoz-Sabater et al. 2021); Annual NLCD Collection 1.2 (U.S. Geological Survey 2026).

Reported detections changed markedly by year and place
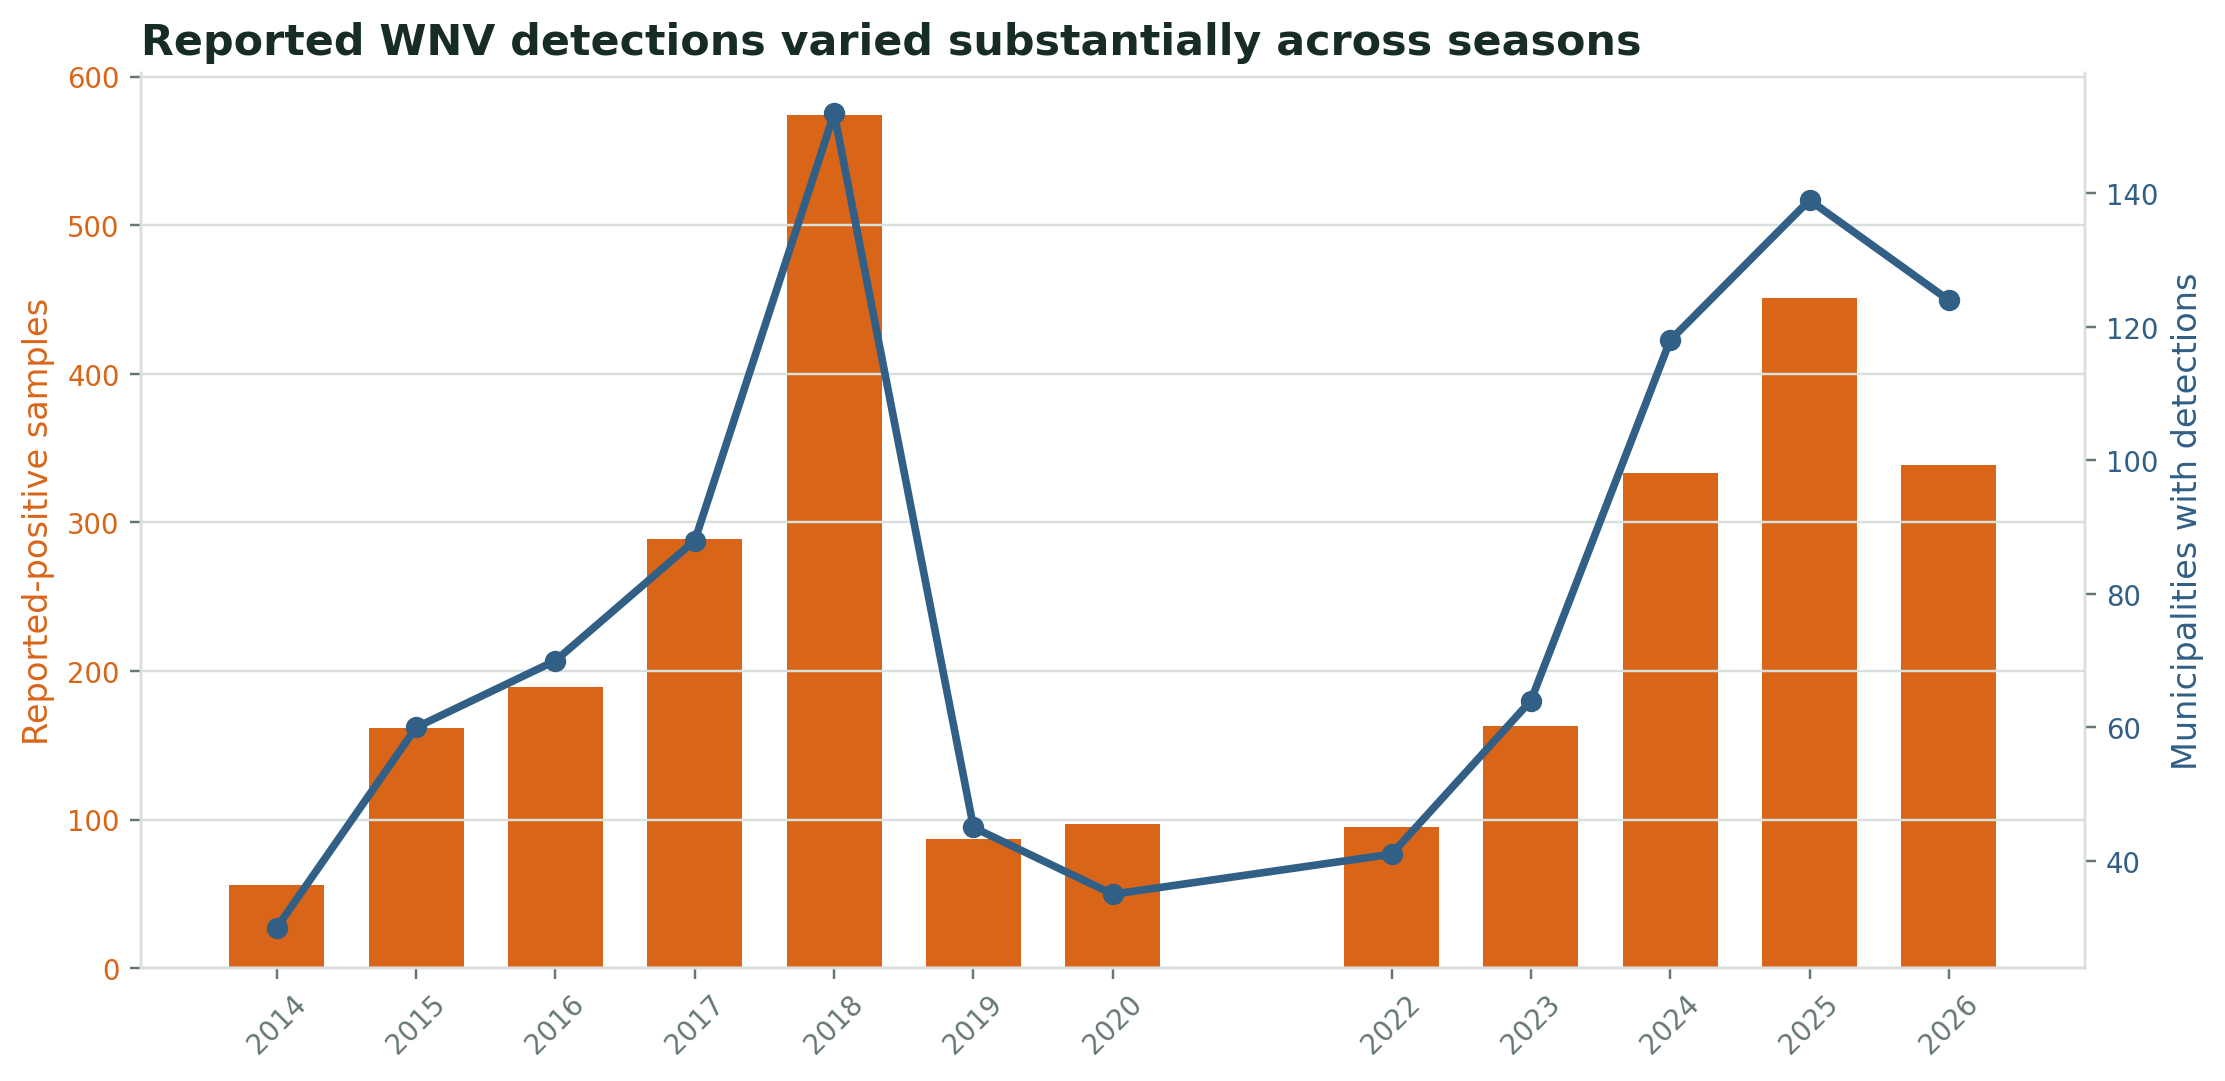
Annual reported-positive WNV mosquito samples and municipalities with detections in Massachusetts from 2014 through 2026.

In 2026, surveillance recorded 339 reported-positive samples in 124 municipalities during June–September.

Pooled town heterogeneity reduces correlation strength
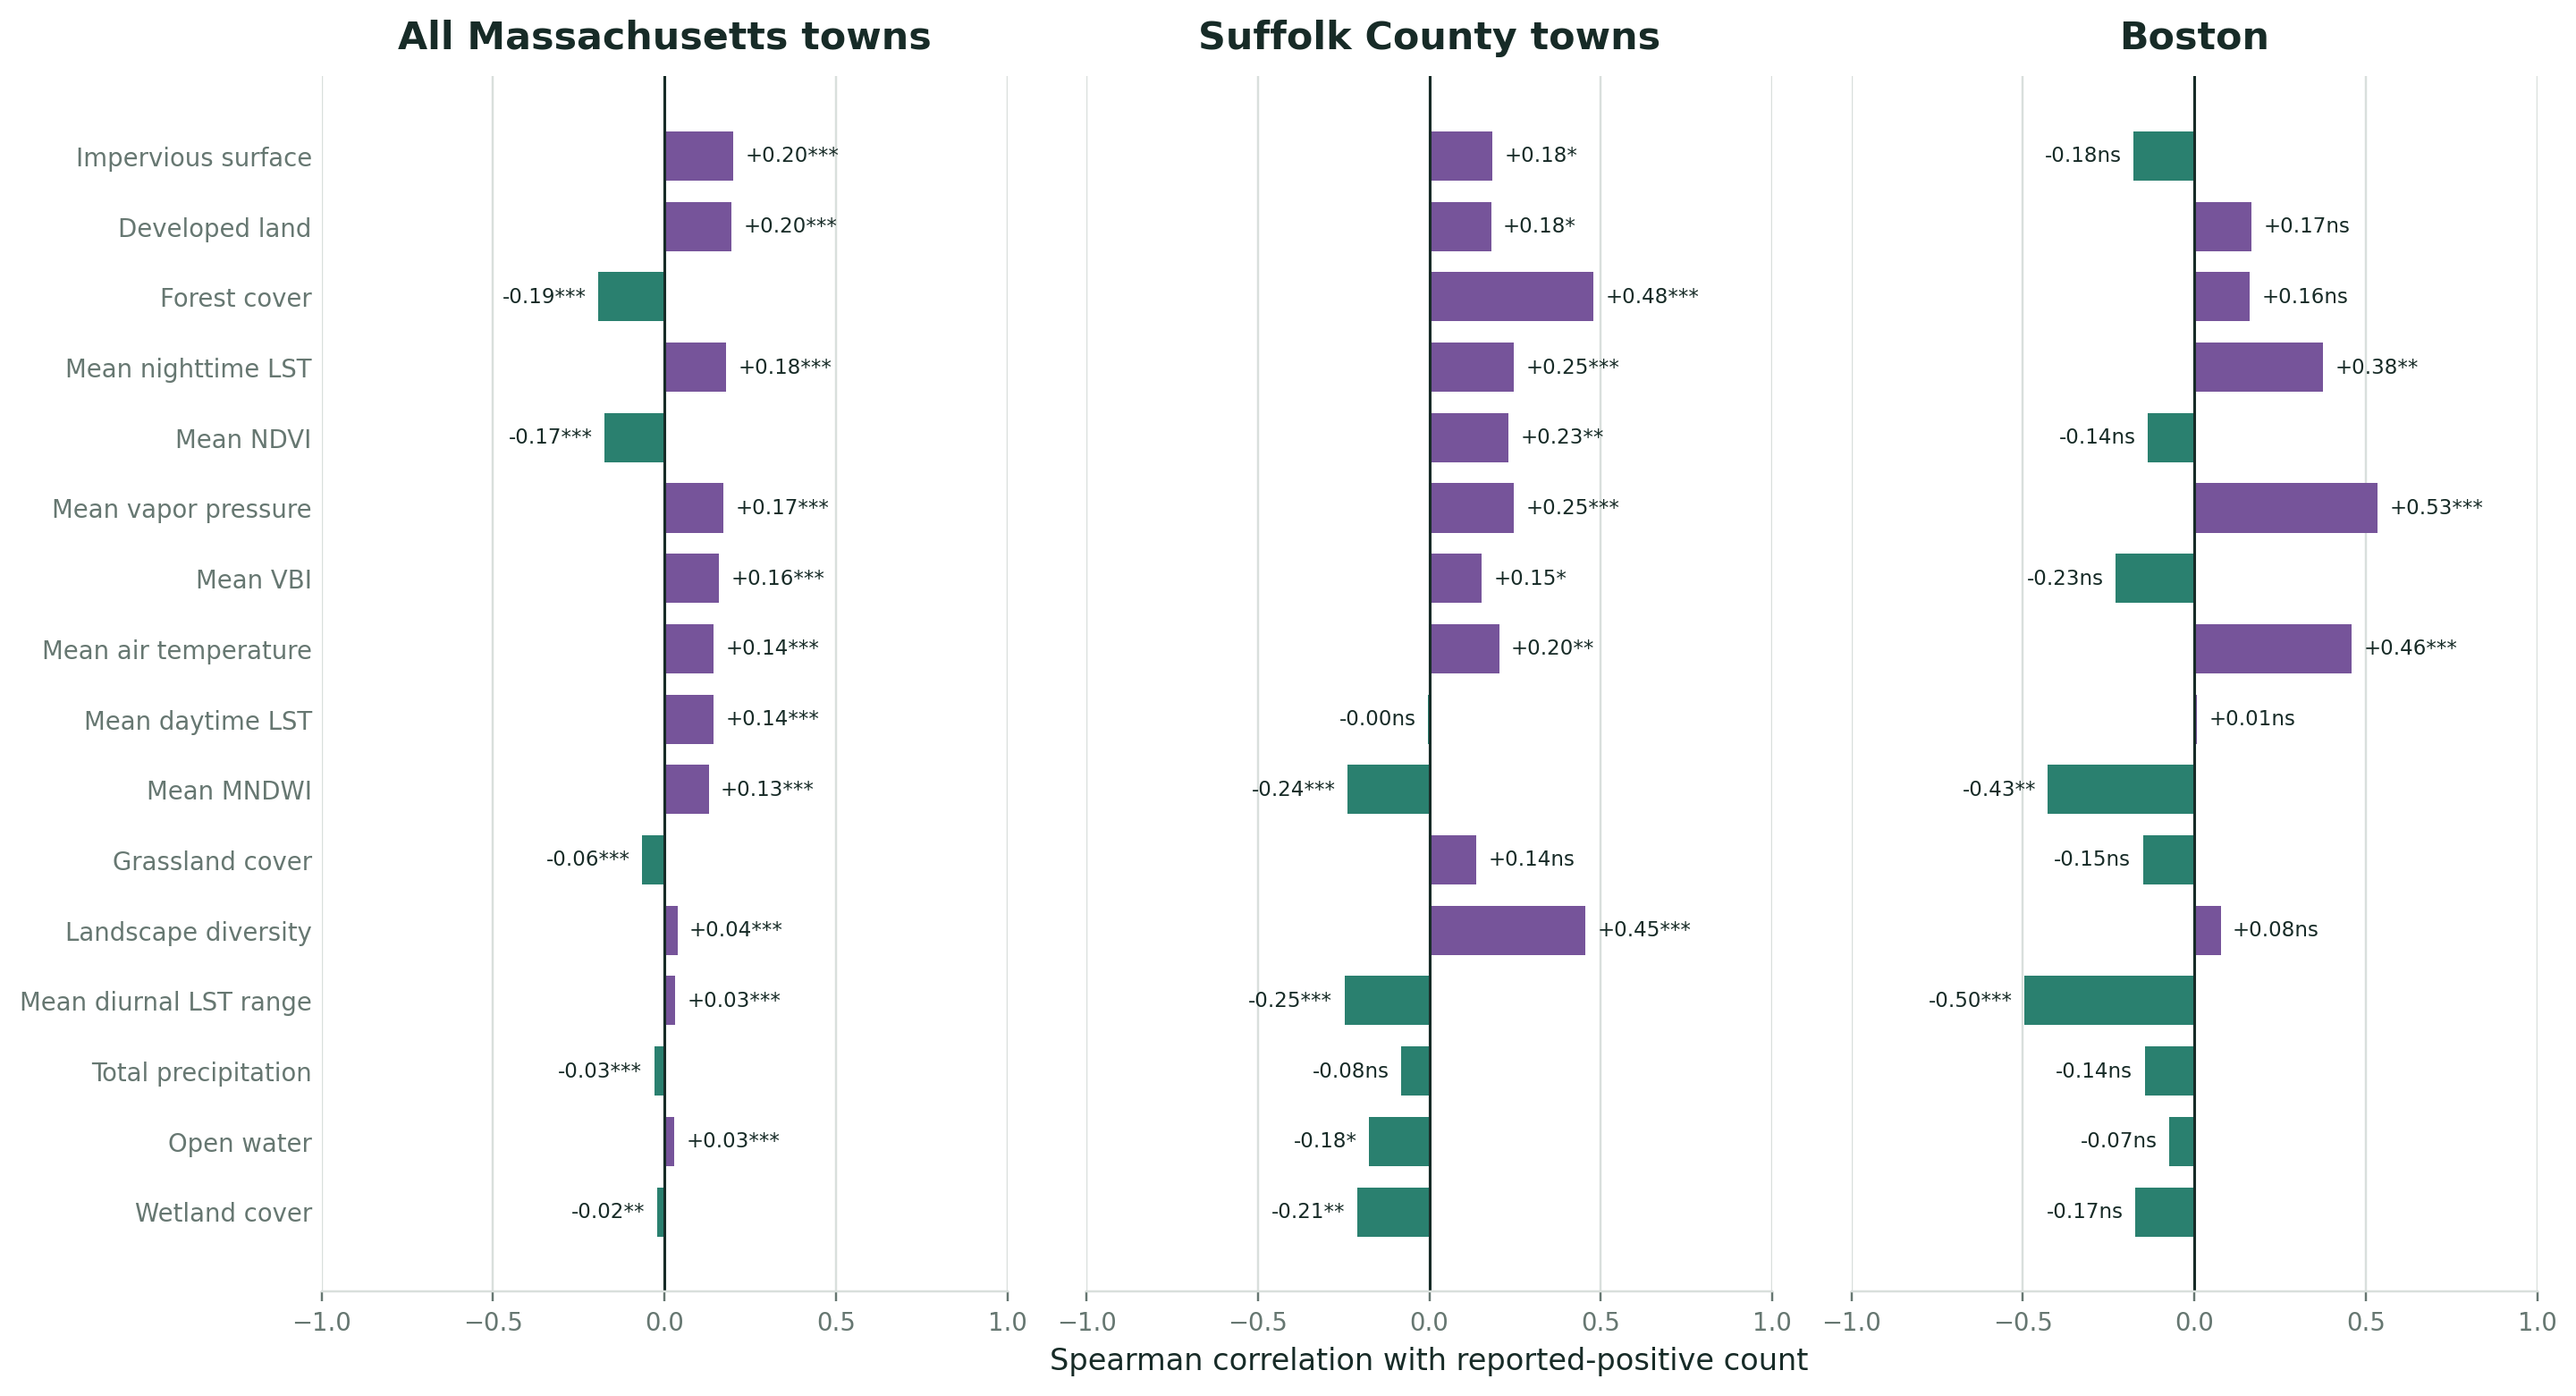
Dashboard-matched Spearman correlation rankings using town-month observations for all Massachusetts towns, Suffolk County towns, and Boston.

Correlations become more diluted as municipalities with different environments and surveillance patterns are pooled together.

A two-stage Random Forest matches the outcome structure

Stage 1: detection presence

Random Forest classifier estimates the probability of at least one reported-positive sample.

P(Y > 0)

Stage 2: positive count

Random Forest regressor estimates the count conditional on a reported detection.

E(Y | Y > 0)

Expected reported-positive count

\[E(Y)=P(Y>0)\times E(Y\mid Y>0)\]

Predictors include previous-month environment, prior-year landscape, target month, municipality area, and geographic identity. Random Forests accommodate nonlinearities and interactions (Breiman 2001).

Future-year holdouts test genuine forecasting performance
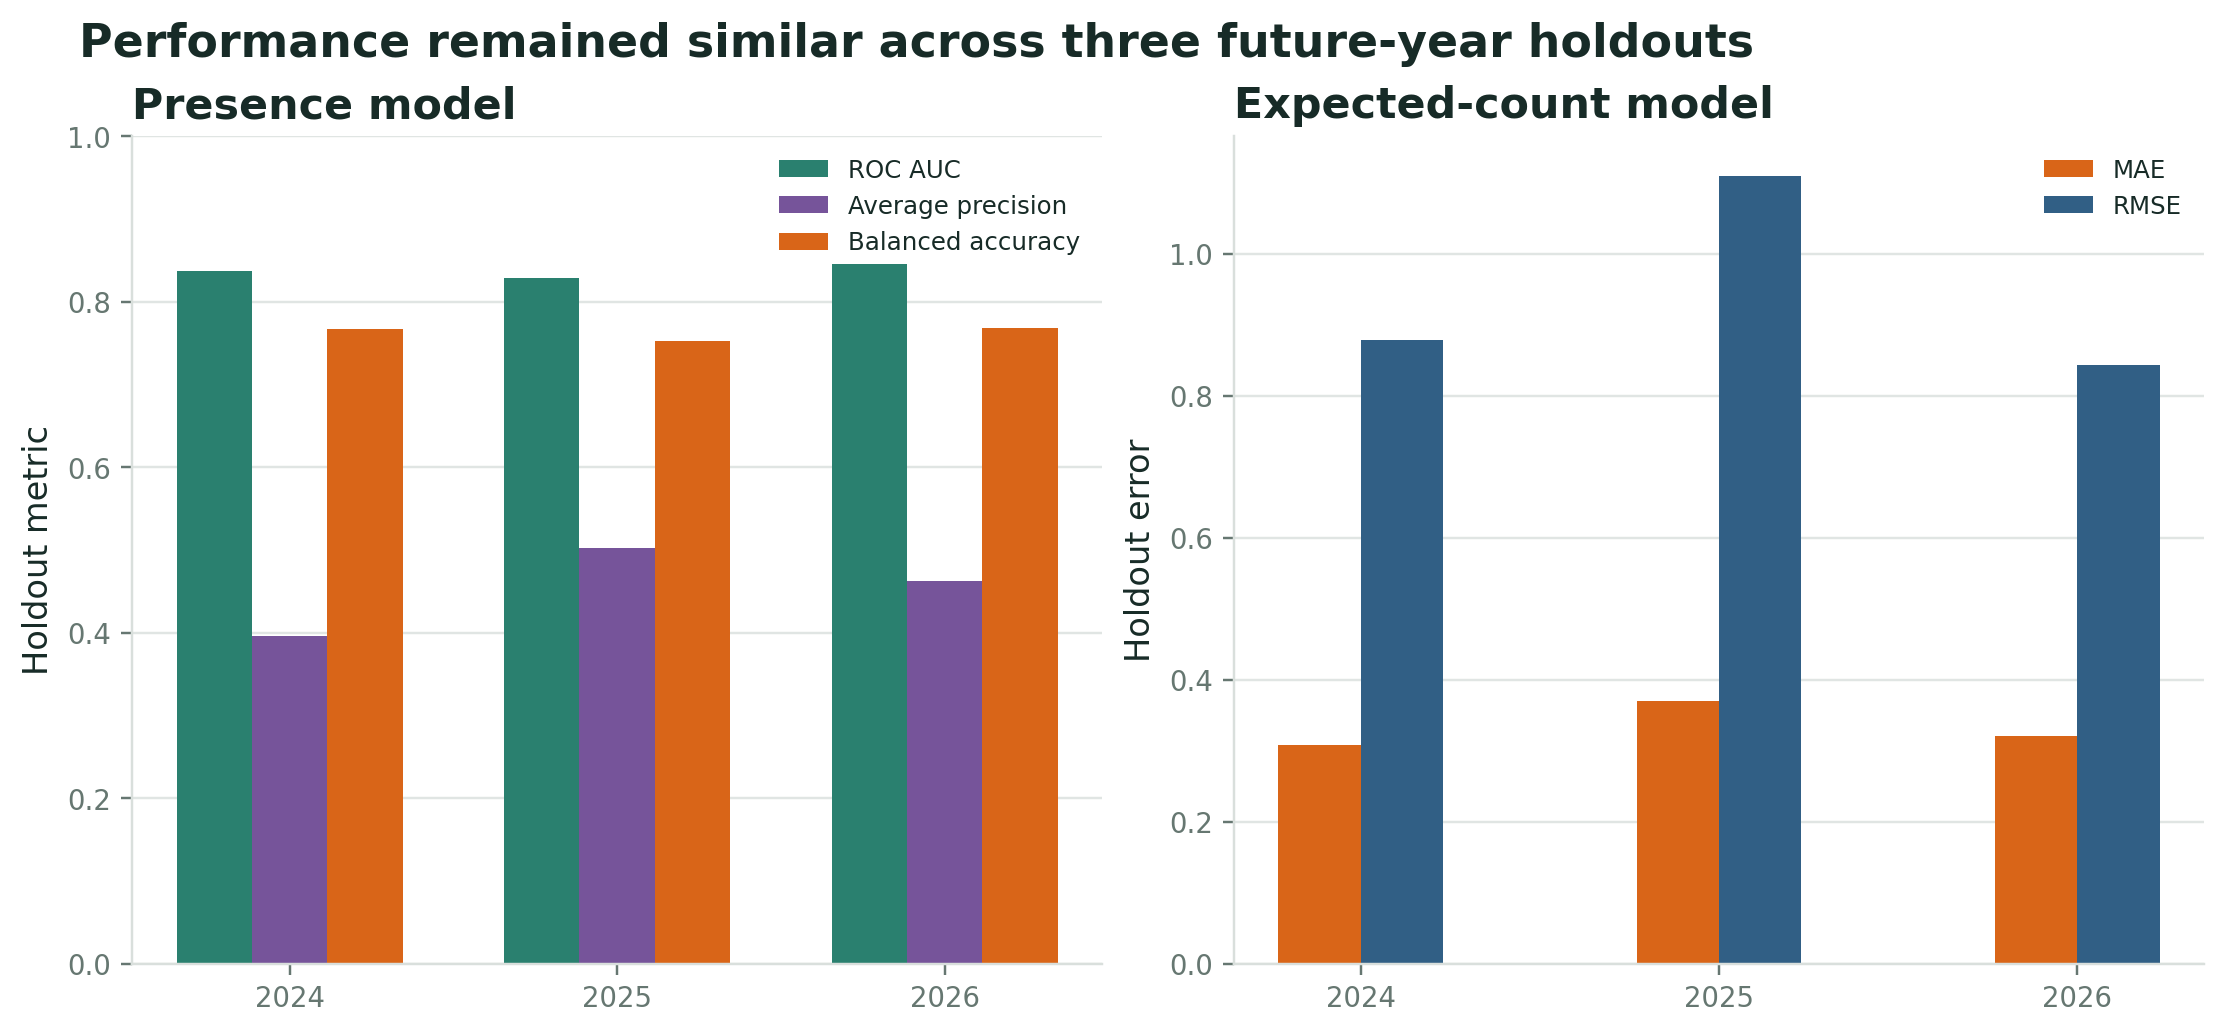
Presence and expected-count Random Forest performance for 2024, 2025, and 2026 future-year holdouts.
Holdout ROC AUC Average precision Balanced accuracy Count MAE Count RMSE
2024 0.837 0.396 0.767 0.308 0.879
2025 0.829 0.503 0.753 0.369 1.110
2026 0.845 0.462 0.768 0.321 0.844

Temporal, thermal, and landscape variables all contribute
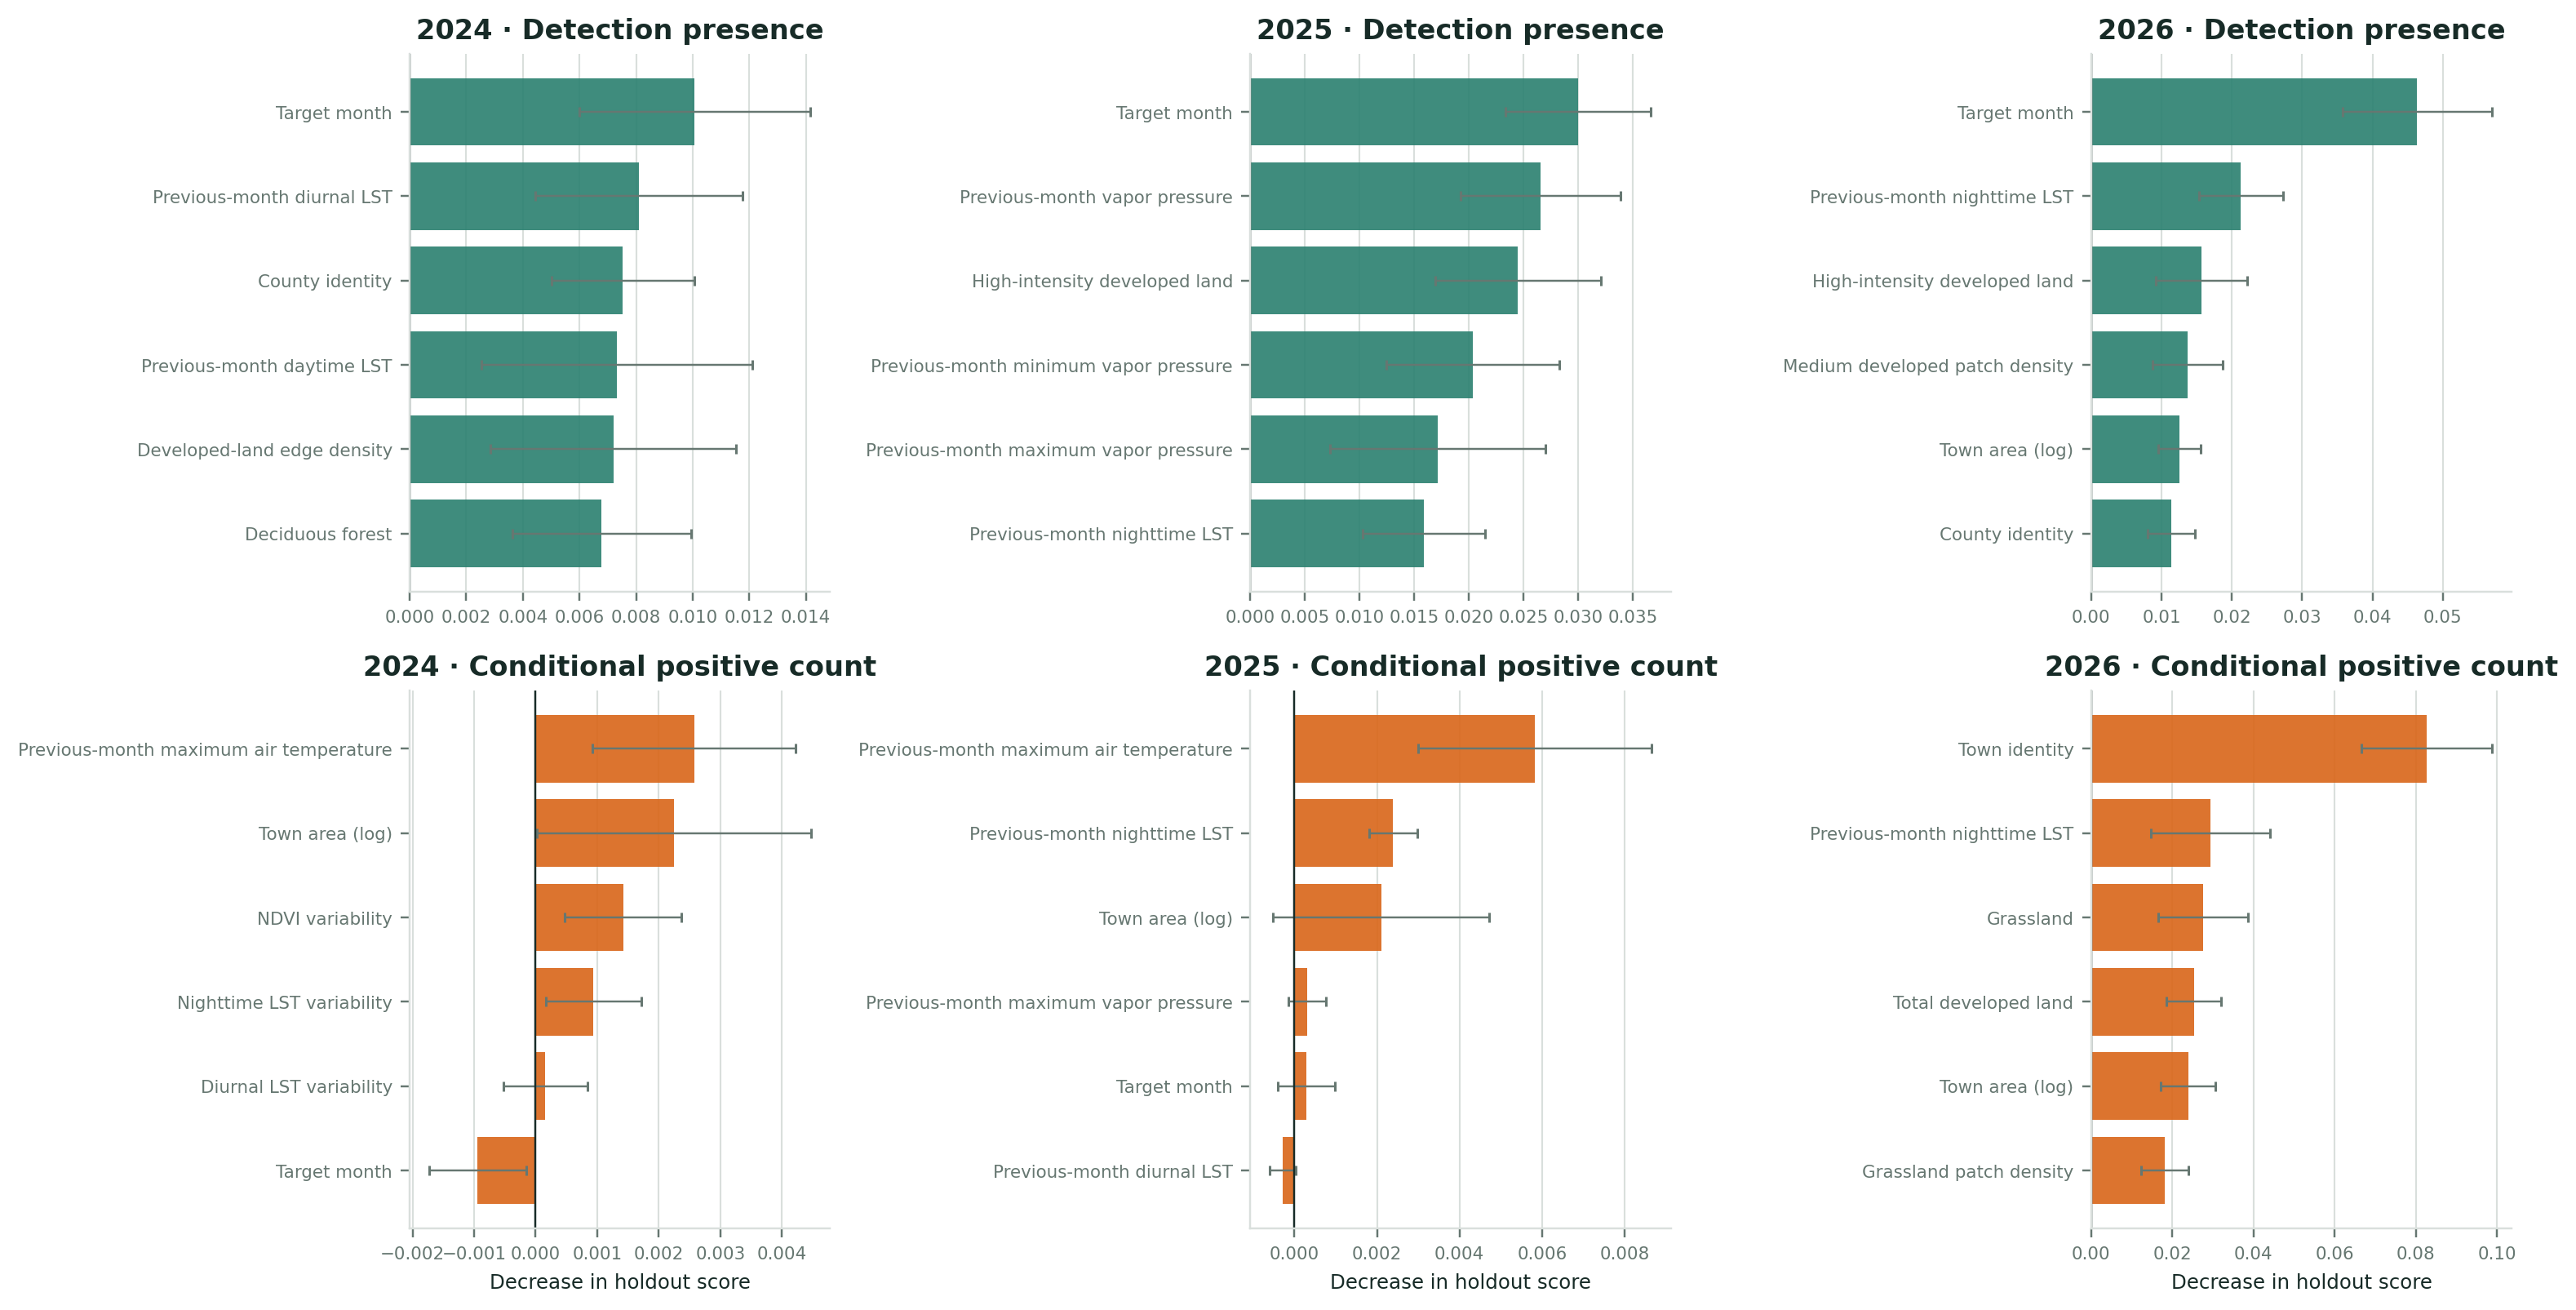
Permutation importance for detection-presence and conditional positive-count Random Forest models evaluated in the 2024, 2025, and 2026 future-year holdouts.

Permutation importance measures loss of holdout performance after shuffling a predictor. It does not indicate effect direction or causality.

Future-year suitability and holdout performance
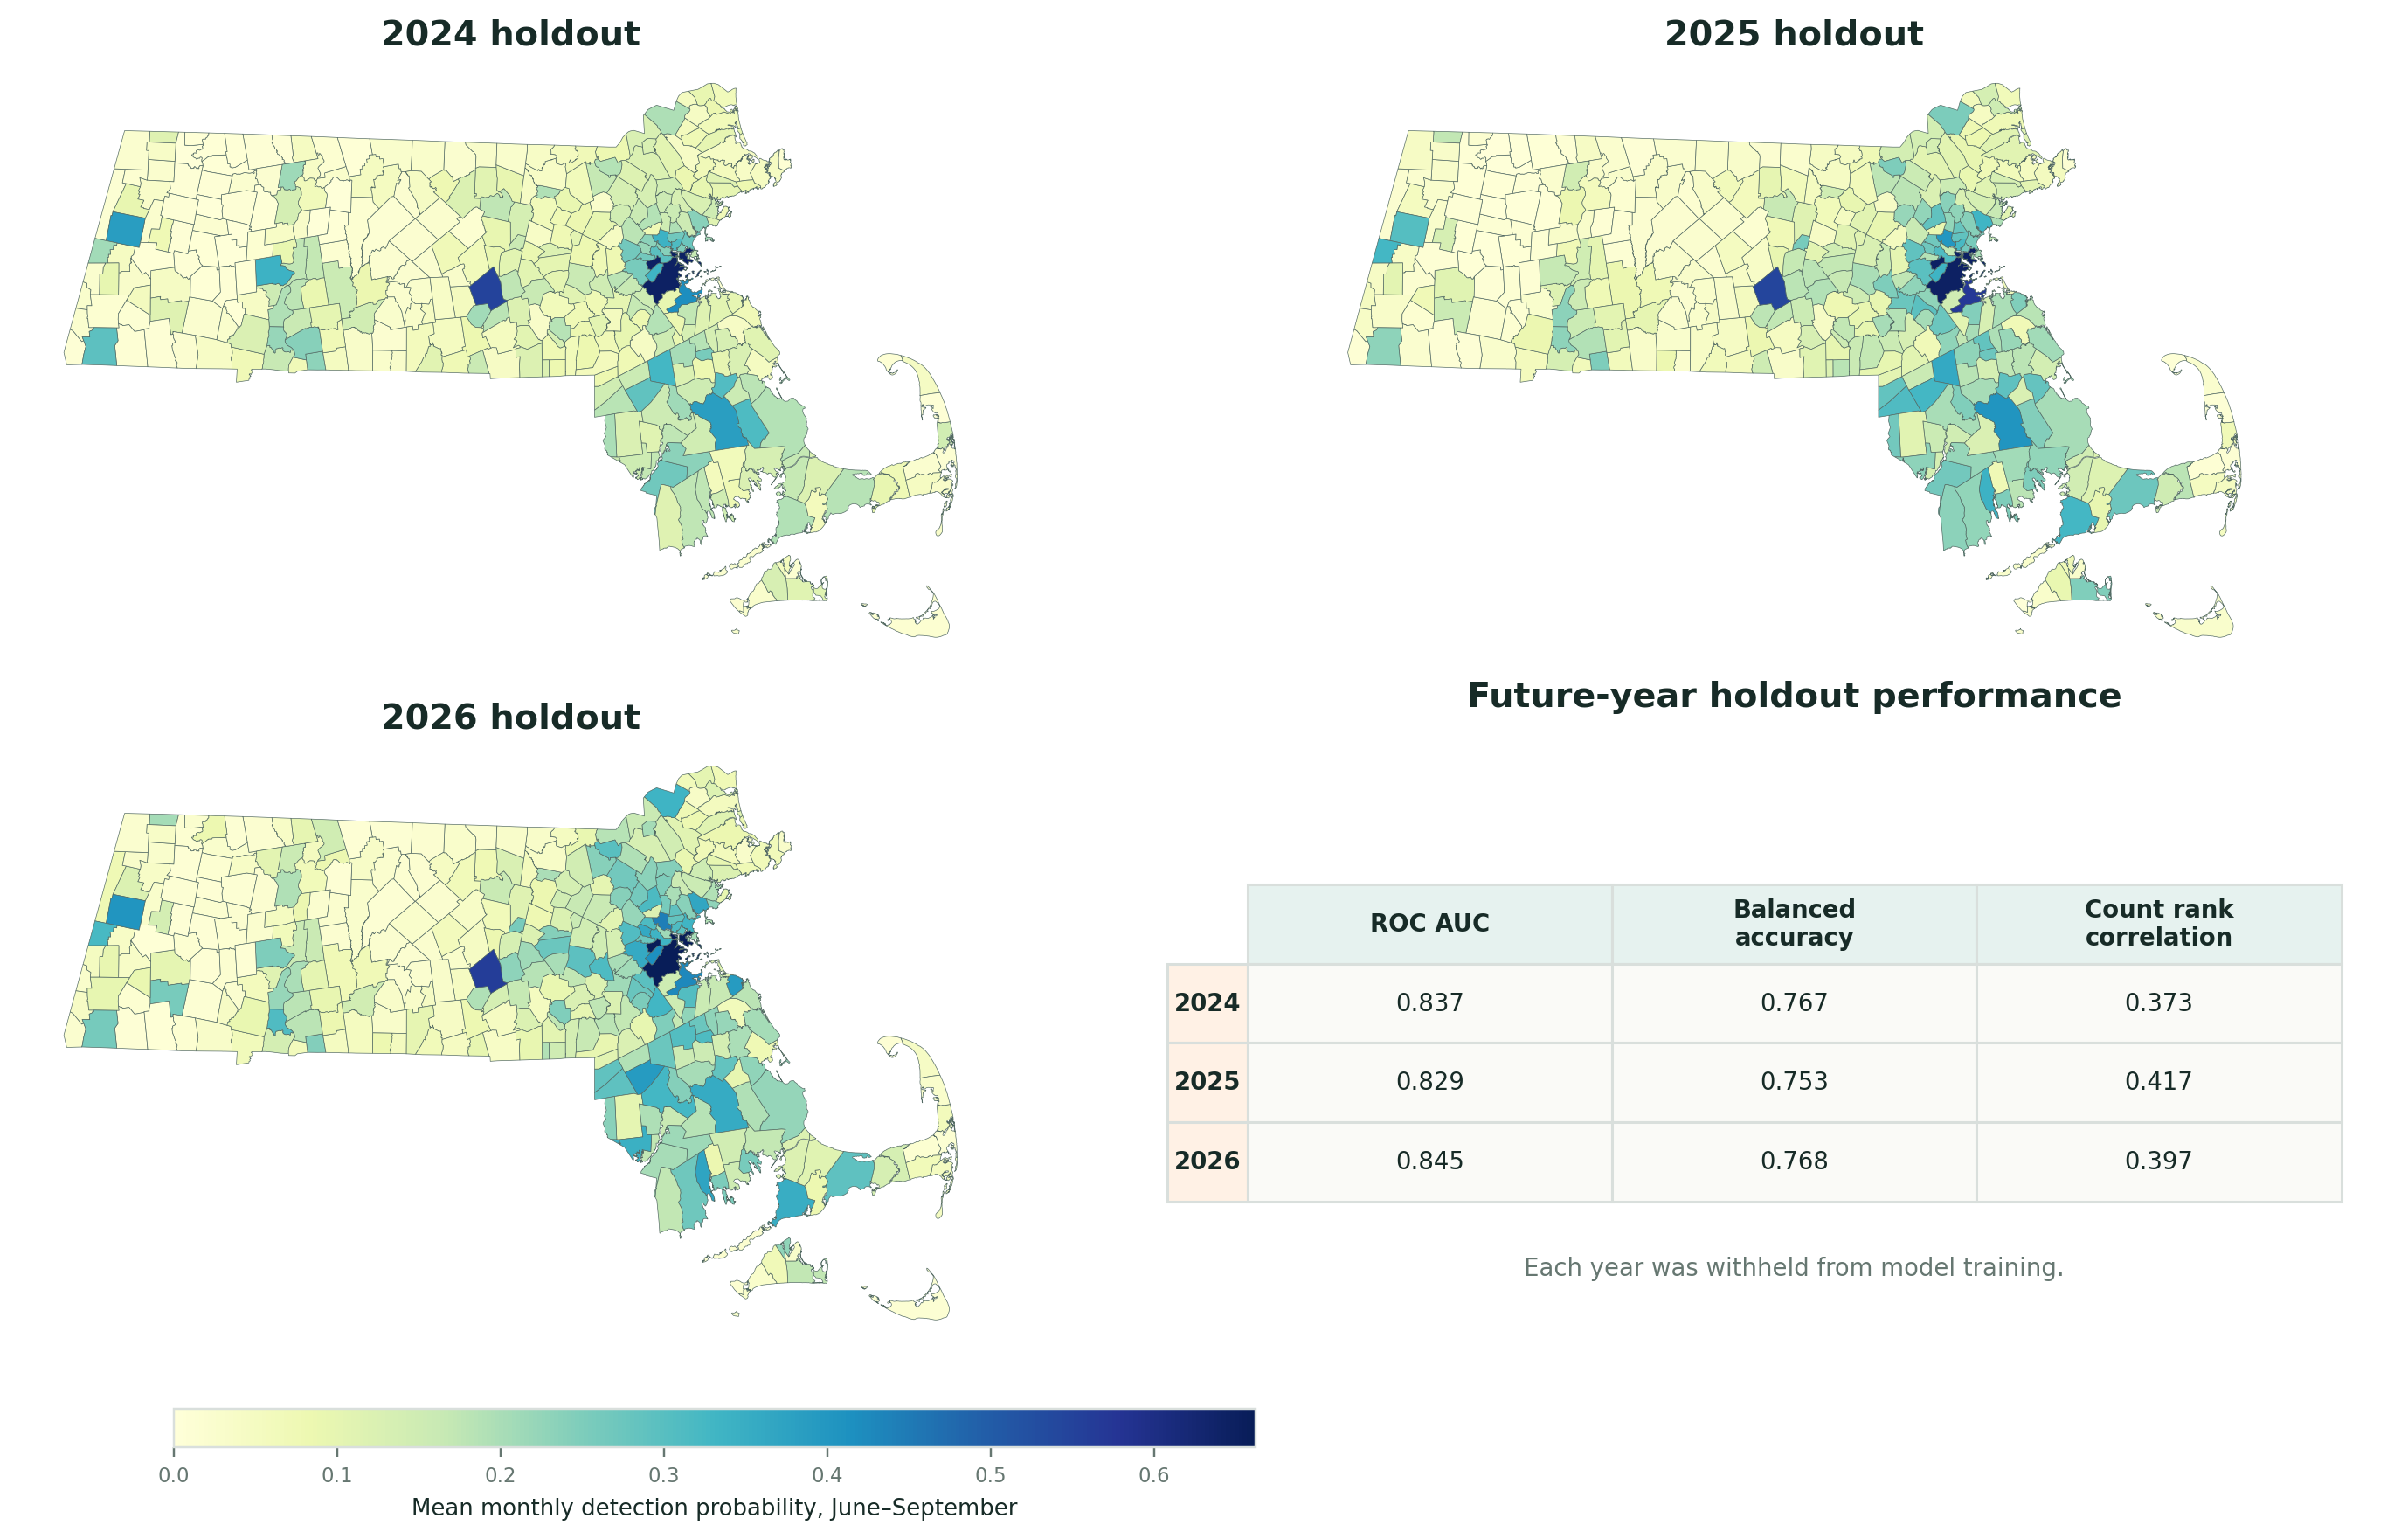
A two-by-two framework containing municipality-level Random Forest suitability maps for the 2024, 2025, and 2026 future-year holdouts and a performance table reporting ROC AUC, balanced accuracy, and count rank correlation.

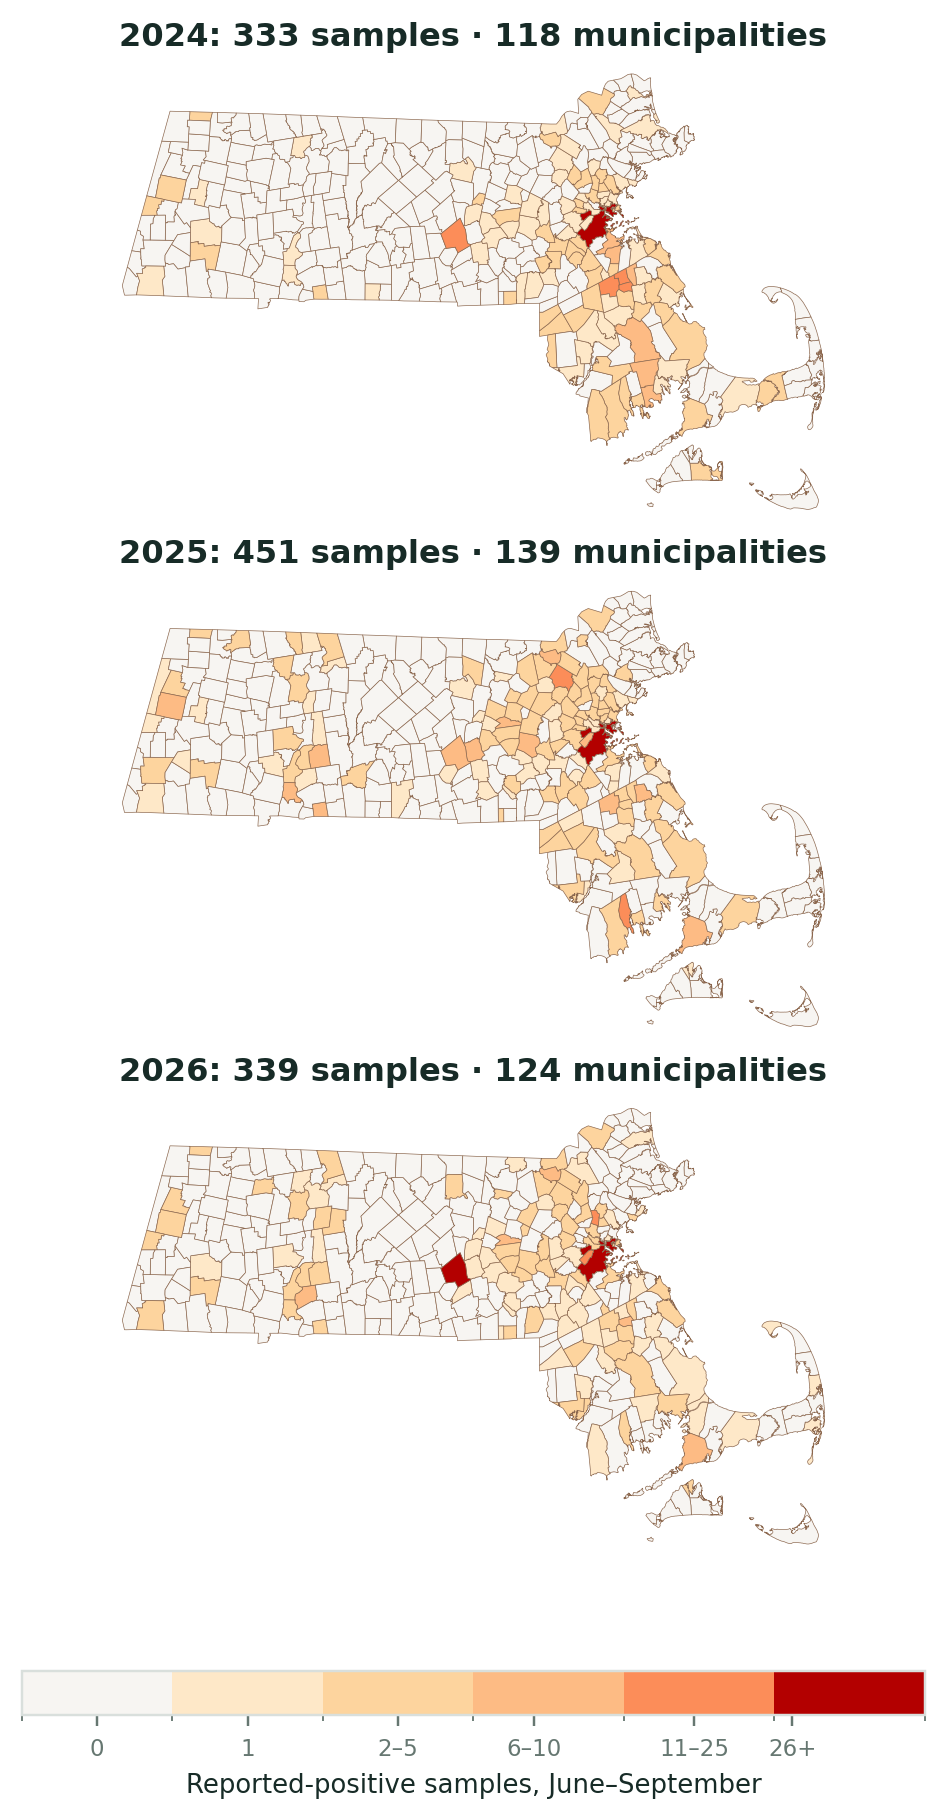
Three vertically stacked municipality maps show observed reported-positive mosquito samples during June through September for 2024, 2025, and 2026, using one shared count scale.

All future-year holdouts identify higher reported-detection suitability in parts of eastern Massachusetts.

Surveillance effort remains the central limitation

What the model estimates

  • Probability of a reported-positive municipality-month
  • Expected number of reported-positive samples
  • Relative spatial and seasonal suitability

What the model cannot estimate

  • Absolute mosquito infection prevalence
  • Mosquito abundance without trap effort
  • Human disease risk
  • A causal effect of temperature or land cover

Town and county identity can reveal persistent geographic patterning, but they do not directly measure trap placement, testing volume, or sampling frequency.

Three findings support a surveillance dashboard

  1. Reported detections show strong spatial and interannual heterogeneity.
  2. Previous-month heat, urban development, and geographic context improve short-term prediction.
  3. Temporal holdouts show stable discrimination, but uncertainty and surveillance bias must remain visible.

References

Breiman, Leo. 2001. “Random Forests.” Machine Learning 45: 5–32. https://doi.org/10.1023/A:1010933404324.
Li, Weizhi, Aiyin Zhang, and Florencia Sangermano. 2026. “The Visible Built-up Index: Advancing the Detection of High-Albedo Urban Areas.” Remote Sensing Letters 17 (2): 123–31. https://doi.org/10.1080/2150704X.2025.2609845.
Massachusetts Department of Public Health. 2026. Arbovirus Surveillance Plan and Historical Data. https://www.mass.gov/lists/arbovirus-surveillance-plan-and-historical-data.
Muñoz-Sabater, Joaquín, Emanuel Dutra, Anna Agustí-Panareda, et al. 2021. “ERA5-Land: A State-of-the-Art Global Reanalysis Dataset for Land Applications.” Earth System Science Data 13: 4349–83. https://doi.org/10.5194/essd-13-4349-2021.
U.S. Geological Survey. 2026. Annual National Land Cover Database Collection 1 Products (Version 1.2, June 2026). U.S. Geological Survey. https://doi.org/10.5066/P94UXNTS.
U.S. Geological Survey, and Jon Dewitz. 2023. National Land Cover Database 2021 Land Cover Products. U.S. Geological Survey. https://doi.org/10.5066/P9JZ7AO3.
Vermote, Eric, and Robert Wolfe. 2021. MODIS/Terra Surface Reflectance Daily L2G Global 1 Km and 500 m SIN Grid, Version 6.1. NASA EOSDIS Land Processes Distributed Active Archive Center. https://doi.org/10.5067/MODIS/MOD09GA.061.
Wan, Zhengming, Simon Hook, and Glynn Hulley. 2021. MODIS/Terra Land Surface Temperature/Emissivity Daily L3 Global 1 Km SIN Grid, Version 6.1. NASA EOSDIS Land Processes Distributed Active Archive Center. https://doi.org/10.5067/MODIS/MOD11A1.061.